


What view-through attribution means in B2B
The Problem
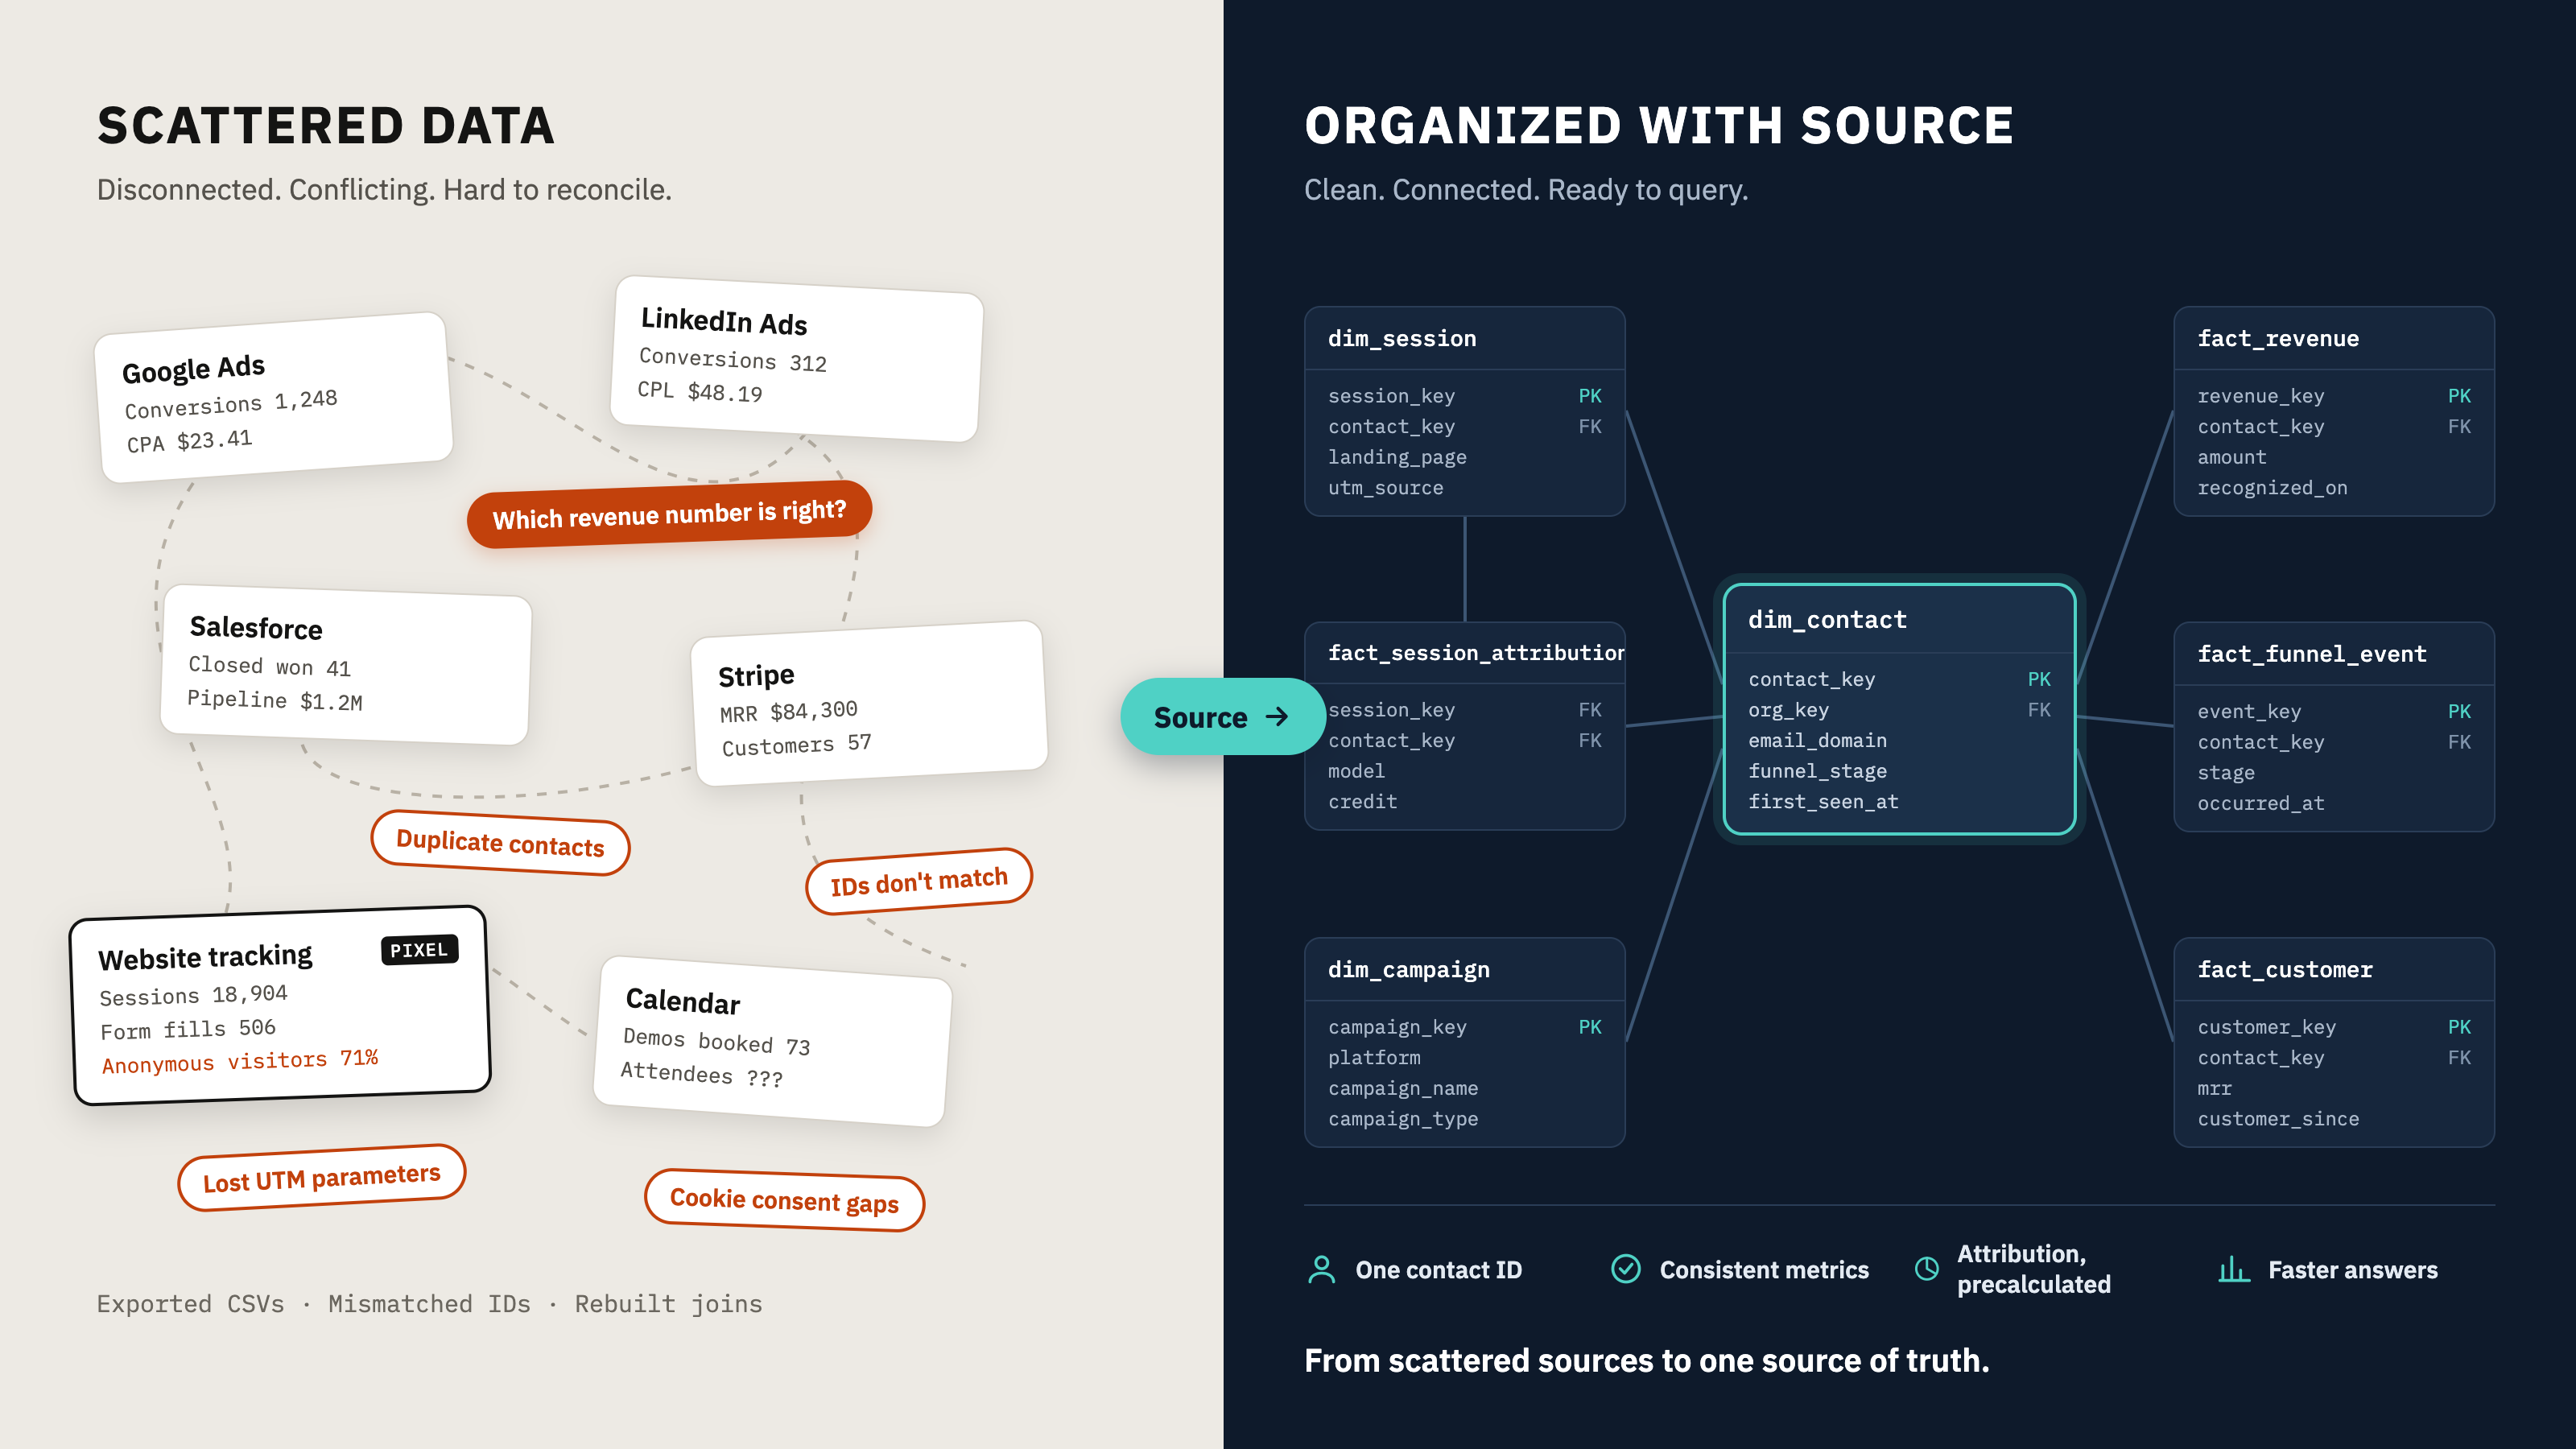
Your company relies on a ton of systems to thrive. Your website captures conversions, Google Ads and LinkedIn Ads drive users, Salesforce manages your sales pipeline, and Stripe processes payments and keeps your books.
Each of those platforms is owned by a different department tracking different KPIs. So marketing and sales show up to the same meeting with different revenue numbers, and nobody fully trusts either one.
RevOps and analytics teams are the ones who turn this sprawl into answers leadership can act on: which campaigns actually drive revenue, where deals stall, what a customer is really worth. That’s high-leverage work. But too often, the hours go to stitching instead of thinking: exporting CSVs, reconciling mismatched IDs, and rebuilding the same joins every quarter.
Source takes the stitching off their plate. It captures data from every system you rely on, organizes it into a single warehouse built around your contacts, and delivers it wherever your team already works.
The Source Solution
Source captures disparate data from all over the internet, organizes it into an intuitive format, and makes your data available to your team in a format that integrates into their existing workflows.
- Source Dashboard gives canned access to the most important data needed to optimize revenue for your business.
- Source integrates with Slack to give you daily, weekly, or monthly updates delivered directly to your company’s chat.
- Source Chat provides an LLM with instructions on how to query your data, so you can ask it whatever you want. It even knows how to make visual charts.
- Source MCP gives your agents access to your data. Source’s intuitive database means agents can reason about your data without having to pull gigabytes of data into context.
- Want to Bring Your Own BI tool? Connect your BI tool to Source’s data warehouse to build robust reports that execute quickly and accurately.
- Source API provides you connections into all of your data sources using one API key.
How it Works
Setup
Install Source’s tracking pixel on your website, then connect your ad accounts, CRM, payment system, and calendar app. That’s it.
The pixel can be configured to be aware of your cookie banner, so tracking stays consistent with the consent choices your visitors make.
Configure Conversion Tracking
Every business defines a conversion differently, so Source supports several methods, all managed from your settings page:
- Specific page loads, like a thank-you page
- Funnel stages in your CRM
- Server-to-server events
- Meetings booked in your calendar app
- Payments and subscriptions
Capture
Source pulls data directly from each connected system and saves it as-is in a data lake:
- Page loads, form submissions, and page exits on your website
- Funnel progression from your CRM
- Every meeting booked in your calendar app
- Payments and subscriptions from your payment system
- Performance metrics from your ad platforms
Because Source keeps your raw data intact, nothing is ever lost. When your attribution rules or funnel stages change, Source can reprocess your full history against the new definitions, so last year’s numbers stay comparable to this year’s.
Organize
Raw data in a lake is a start, but it’s not something you can report on. This is where Source does the work your team would otherwise spend weeks building, and keep rebuilding.
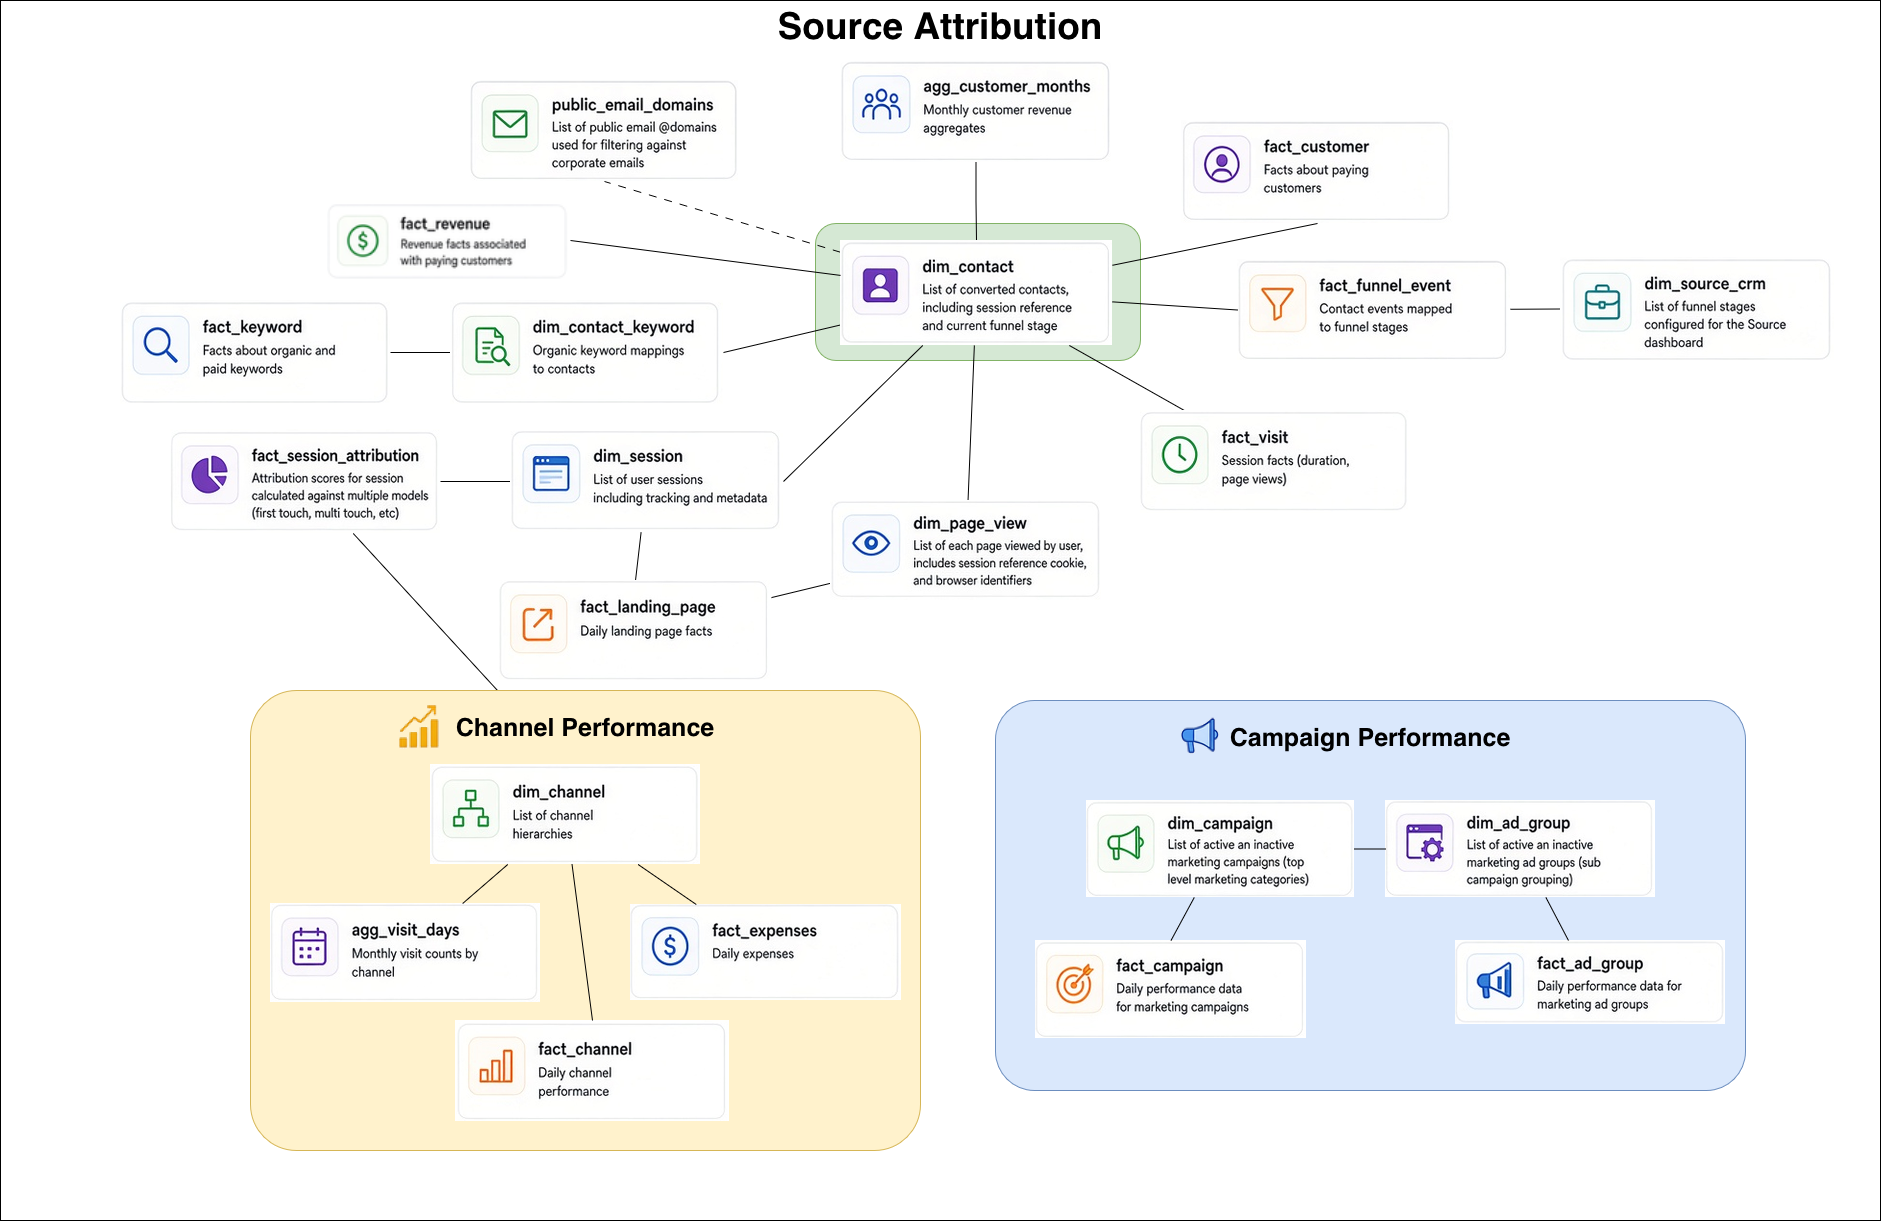
One contact, every touchpoint. Source assigns each visitor a universal contact ID that follows them across every connected system. The ad they clicked, the pages they read, the demo they booked, the deal stage in Salesforce, and the payment in Stripe all connect back to one person. You can finally trace a straight line from a LinkedIn campaign to closed revenue.
People buy as companies, so Source sees companies. Peter signs up for your app. Two weeks later, Paul from the same company enters a credit card. Most tools see two unrelated people. Source groups colleagues under the same organization, filtering out personal addresses like Gmail and Yahoo, so the campaign that brought in Peter gets credit for Paul’s subscription.
One vocabulary across every ad platform. Google calls it a campaign and an ad group. LinkedIn calls it a campaign group and a campaign. Source maps both into a single campaign and ad group structure, so cross-channel comparisons are one query instead of a reconciliation project.
A schema built for the way analysts think. Everything is organized around the contact, in a clean star schema of facts and dimensions. Most questions take one or two joins, with no nested subqueries and no reverse-engineering someone else’s pipeline.
The hard math is already done. Attribution scores are precalculated across multiple models, including first touch and multi-touch. Daily channel performance, monthly visit counts, and monthly customer revenue are ready to query. Likely bots and spam are tagged, so they don’t inflate your numbers.
Zoom out or drill all the way down. Start with monthly revenue by channel, then follow it down to the individual session, and even the single page load, that started a customer’s journey.
Report
Because everything in Source is organized around your contacts, the questions RevOps gets asked constantly become simple queries:
- What’s our true cost to acquire a paying customer, by channel?
- Which keywords bring in contacts who actually close?
- How long does it take to go from first visit to first payment?
- Which campaigns influence deals, even when they aren’t the first or last touch?
Put Your Data to Work
Source delivers your organized data in the tools your team already uses:
- Bring your own BI tool. Connect Looker, Tableau, Power BI, or any SQL-based tool directly to Source’s data warehouse, and build reports that run quickly and accurately.
- Source MCP. Give your AI agents access to your data. Because the warehouse is already organized, agents can reason about your business without pulling gigabytes of raw data into context.
- Source Chat. Ask a question in plain English, like “which campaigns drove Q3 revenue?”, and get an answer back, complete with a chart.
- Source Dashboard. Ready-made views of the metrics that matter most for growing revenue, available from day one.
- Slack updates. Daily, weekly, or monthly summaries delivered straight to your team’s channels.
- Source API. Marketing integrations usually land at the bottom of engineering’s backlog. With Source, they don’t have to compete for that time. Your developers get one API key and one consistent interface to data from your ad platforms, CRM, payments, and website, instead of building and maintaining a separate integration for each.
Let Your Analysts Analyze
Give your RevOps team a warehouse that’s already clean, connected, and modeled around your customers. They’ll spend less time preparing data and more time on the answers leadership is waiting for.
Install the pixel and connect your first data source in minutes. Start your free trial