


Why your attribution numbers don't match across GA4, ads, and CRM

Attribution discrepancies are the gaps between what your ad platforms, your web analytics, and your CRM say a channel produced. Google Ads reports 42 conversions. GA4 shows 27. The CRM shows 9 opportunities from paid search. All three are pulling from the same quarter and the same buyers. This guide walks through why the numbers disagree, which gaps are normal, and how to fix the ones that are not.
Why don't my attribution numbers match?
Because each tool is answering a different question. An ad platform counts conversions it can tie to its own clicks and views. Web analytics counts events in sessions it was allowed to record. The CRM counts people and deals, usually credited to whatever source was written on the record first.

So the first step is not to pick a winner. It is to agree on which question each number answers, then find the gaps that are larger than those definitions explain. In B2B, the number that matters most is the one tied to pipeline and revenue, which is why we treat the CRM as the place where the answer has to land. Our piece on why GA4 cannot tell you which channel closed the deal covers that difference in more depth.
How do you diagnose an attribution discrepancy?
Work through the causes in a fixed order. The early checks are quick and explain most gaps. The later ones take longer and only matter once the simple causes are ruled out.
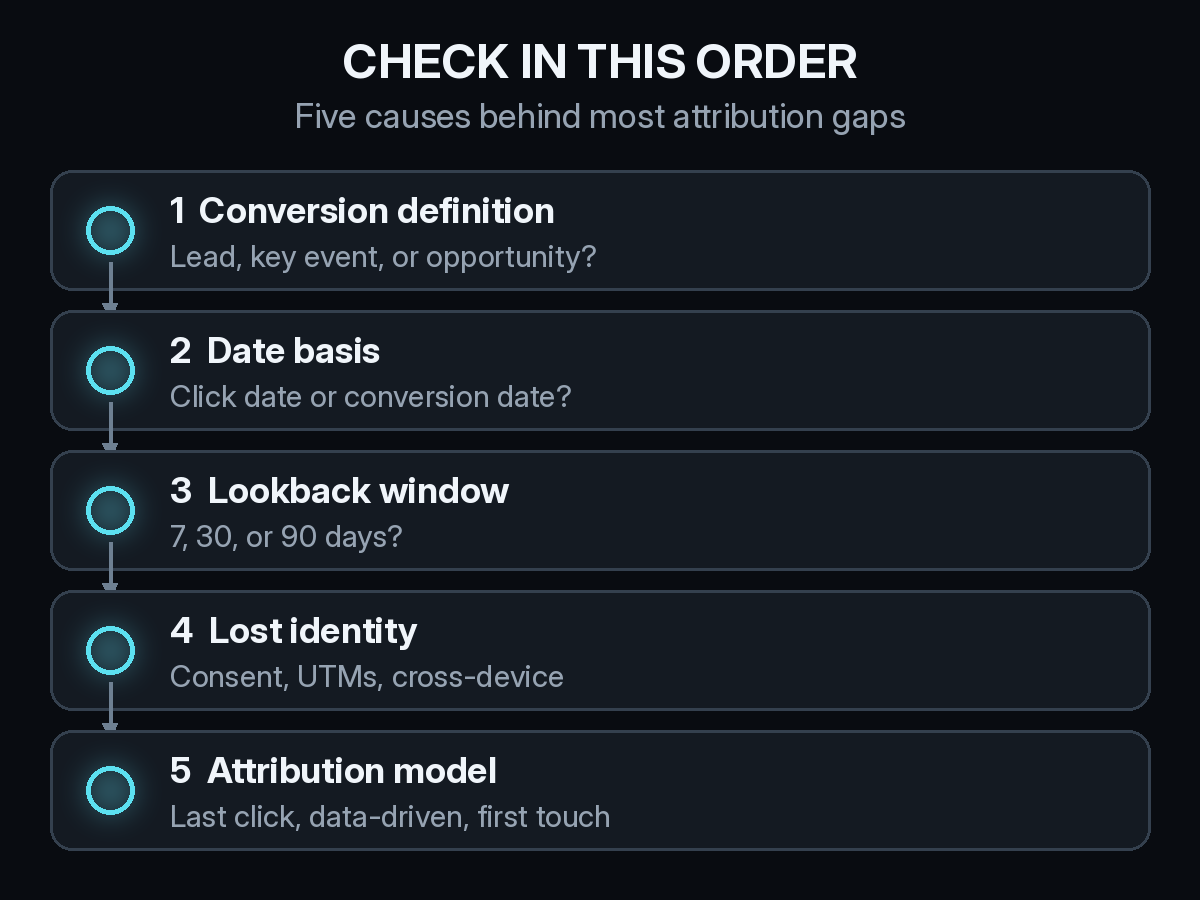
1. Conversion definition
Start by writing down what each tool calls a conversion. An ad platform may count every form fill, including newsletter signups and gated content downloads. GA4 counts whichever events you marked as key events. The CRM counts contacts or opportunities. If one tool counts leads and another counts opportunities, a 4 to 1 gap is expected, not a bug.
Also check for counting rules. Google Ads can count one conversion per click or every conversion, and its All conversions column includes actions that are not in the main Conversions column. A team that compares All conversions to CRM leads will always see a large gap.
2. Date basis
Ad platforms often report a conversion on the date of the click, not the date the conversion happened. The CRM reports on the date the record or deal was created. A buyer who clicked in late March and filled a form in April lands in Q1 in one report and Q2 in the other. With long B2B cycles, this alone can move a meaningful share of conversions between months.
3. Lookback window
Every tool has a window for how long after a click or view a conversion can still be credited. Google Ads lets you set conversion windows per action, often 30 days for clicks. LinkedIn and Meta have their own defaults for clicks and views. Your CRM may have no window at all and simply keep the first source forever. When windows differ, the same deal is in one report and missing from another. Our guide to the attribution window for long B2B sales cycles explains how to pick one window and use it everywhere.
4. Lost identity
This is where most of the unexplained gap usually lives. A buyer clicks an ad on their phone, comes back a week later on a work laptop, and fills a form. The ad platform may still credit itself through its own login data. Your analytics sees two unrelated visitors. The CRM sees a new contact with a source of Direct.
Consent rules add to this. When a visitor declines tracking, GA4 may model or drop their sessions depending on how consent mode is set up. Missing or broken UTMs do the rest. We covered the common causes in UTM mistakes that send B2B deals to Direct and how cookie consent changes marketing attribution.
5. Attribution model
Only now look at the model. Ad platforms usually give themselves credit for any conversion they touched. GA4 uses data-driven attribution by default, which splits credit across channels it can see, as described in Google's attribution overview. Many CRMs default to first touch or to a manual Lead Source field. Three models over the same journey will always produce three different numbers, even with perfect data.
Which gaps are normal, and which mean something is broken?
Some gap is healthy. Ad platforms will almost always report more conversions than your CRM, because they count view-through conversions and give themselves full credit. A platform number that is 1.5 to 3 times the CRM number for the same definition is common.
Look harder when you see any of these patterns:
- The gap moved suddenly. A ratio that was steady for months and then doubled usually points to a tag change, a site redesign, or a new consent banner.
- Direct is growing in the CRM while paid spend is flat. That usually means identity is being lost between the click and the form.
- One campaign shows conversions and zero opportunities. Check whether it is counting a low-intent action, like a content download, as a conversion.
- The CRM shows deals from a channel the ad platform never mentions. Often a sign of offline touches, referrals, or AI search visits that arrive without UTMs.
How do you stop the numbers drifting apart again?
Pick one definition, one date basis, and one window, write them down, and report from them every week. Keep platform numbers as a check on delivery, not as the source of truth for pipeline. Then fix identity at the source, so the click, the visit, the form, and the deal are linked to the same person and account. Our post on how identity resolution connects anonymous visits to B2B pipeline shows what that chain looks like, and CRM hygiene that keeps B2B attribution trustworthy covers the record rules that keep it intact.
A short recurring check helps more than a big quarterly cleanup. The 30 minute weekly attribution review includes a step for comparing platform and CRM numbers so drift shows up within days.
How Source reconciles the three reports
Source installs with one pixel through Google Tag Manager, with no warehouse to build. It ties anonymous visits to people, people to accounts, and accounts to opportunities in your CRM, such as HubSpot. Ad clicks and impressions, offline touches, and LLM traffic from ChatGPT, Claude, Perplexity, and Gemini all land on the same account path, so you read one set of numbers built on one definition and one window.
From there you can see real CAC, goals, and channel quality, chat with the data to ask why a channel's numbers moved, get AI recommendations on where to shift spend, and get a daily Slack report. Your agents can read the same data through the Source MCP once your pixel is in place. Source is SOC 2 Type II and ISO 27001 certified, and customer data is not used to train external models.
If your three reports tell three stories today, start free at dash.source.app/signup and see one path from first click to closed deal.