


Win rate by channel: the attribution metric that shows which leads close

Win rate by channel is the share of closed opportunities from each marketing channel that end as closed won. You take the deals a channel sourced, count the ones that closed either way, and divide the wins by that total. It is the simplest way to see lead quality in B2B attribution, because it shows which channels bring buyers who actually sign, not just buyers who fill out a form.
Most teams track volume first: leads, opportunities, pipeline created. Those numbers matter, but they reward channels that produce a lot of deals whether or not those deals close. Win rate is the check on that.
How do you calculate win rate by channel?
The formula is short. Closed won opportunities from a channel, divided by all closed opportunities from that channel (won plus lost), over the same time window.
The hard part is the inputs. You need every opportunity tied to a channel, and you need to decide which touch gets that credit before you start counting.
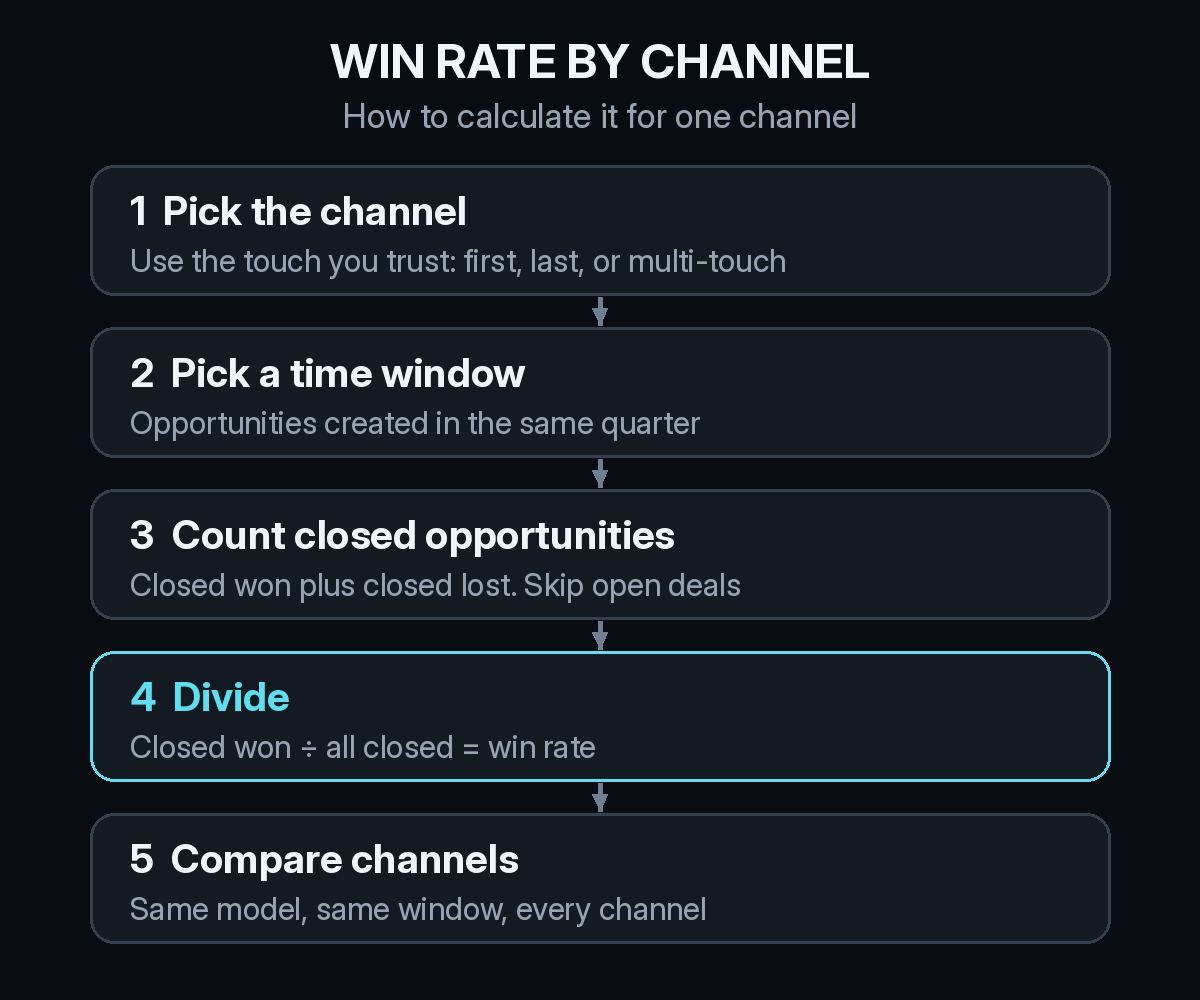
Here is a made-up example to show the math. Say paid search sourced 40 opportunities last quarter. Ten are still open, 9 closed won, and 21 closed lost. The win rate is 9 divided by 30, or 30%. The open deals stay out of the number until they close.
Leaving open deals out of the denominator is the most common fix teams need. If you divide by every opportunity created, newer channels look worse simply because their deals have not had time to finish. That is also why it helps to know your time to pipeline for each channel. Slow channels need a longer window before their win rate means anything.
Which attribution touch should a channel get credit for?
Pick one and stay consistent. There is no single correct answer, but each choice tells you something different.
First touch answers which channel finds buyers who end up closing. Last touch before the opportunity answers which channel tips good buyers into talking to sales. Multi-touch spreads the credit, so each channel's win rate reflects every deal it played a part in.
For a first pass, most B2B teams get the most from first touch, since the question behind win rate is usually where the good buyers come from. Once you trust the numbers, add a multi-touch view next to it. If a channel has a strong first-touch win rate and a weak multi-touch one, it is finding good accounts that other channels then have to carry.
Deals with several contacts make this harder. If the champion found you through a podcast and the economic buyer clicked a search ad, the opportunity has two first touches. We wrote about this in why buying committees break single-contact attribution. Decide upfront whether the opportunity takes the first touch of its earliest contact or of its primary contact.
What does a good win rate by channel look like?
There is no universal benchmark worth trusting, and we would be skeptical of anyone who gives you one. Win rates depend on deal size, sales cycle, how strict your opportunity stage is, and how your reps close out dead deals.
The useful comparison is internal. Compare each channel to your overall win rate, and compare each channel to itself last quarter. A channel that sits well below your average, quarter after quarter, is a lead quality problem. A channel that jumps after a targeting change is telling you the change worked.
How should you read win rate next to volume?
Win rate on its own can mislead. A channel with two opportunities and two wins has a 100% win rate and tells you almost nothing. Read it together with opportunity count, and the channels sort into four groups.
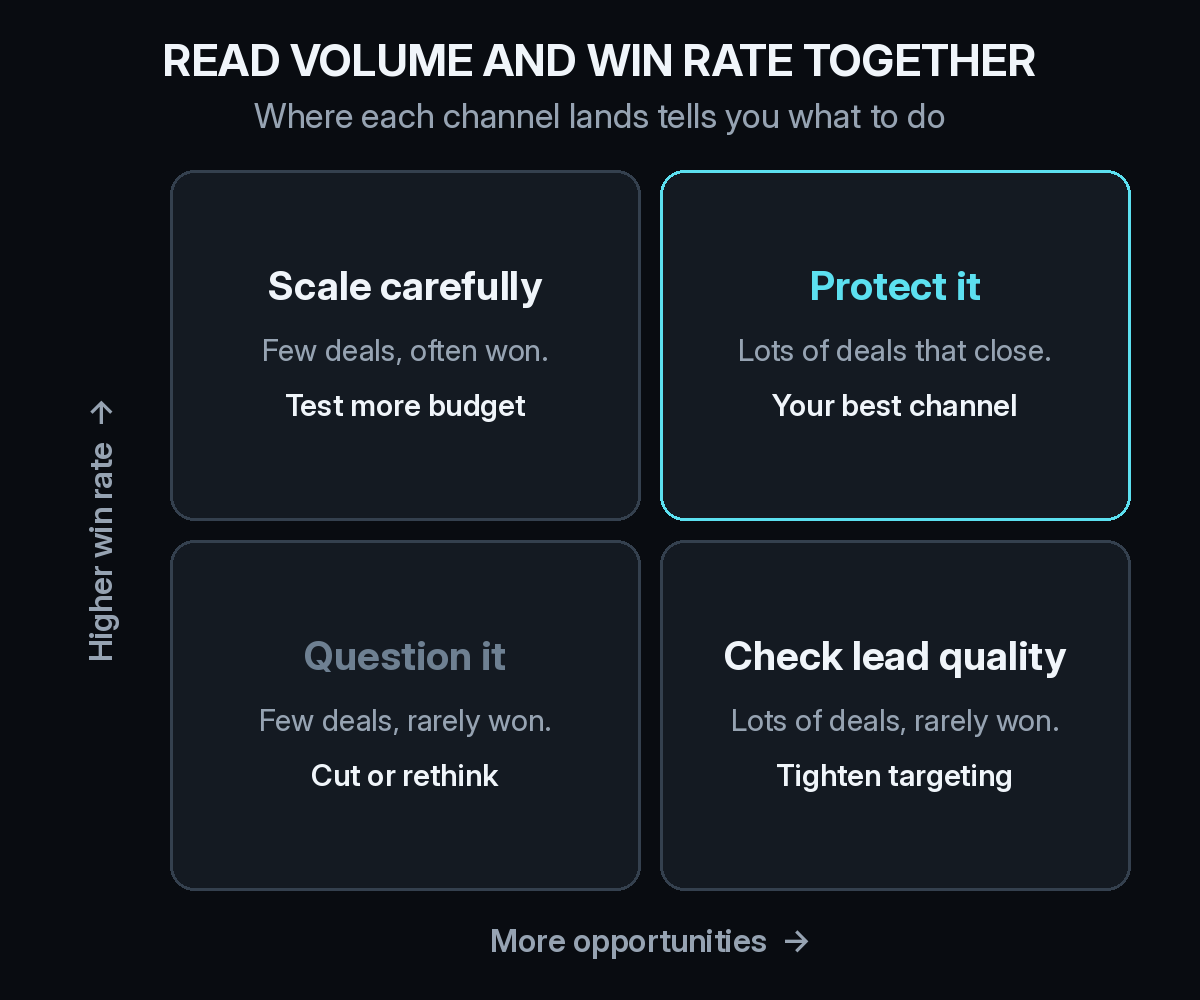
High volume with a high win rate is the channel to protect. Low volume with a high win rate is worth testing with more budget, carefully, because win rates often fall as you scale a channel into colder audiences. High volume with a low win rate usually means targeting is too loose. Low volume with a low win rate is the one to question.
The high volume, low win rate group is where paid channels like Google Ads and LinkedIn Ads often land when they are optimized for form fills. It is the same trap we described in why cost per lead misleads B2B paid ads: the cheapest leads are rarely the ones that close.
How does win rate change CAC and pipeline per channel?
Win rate is what connects pipeline to revenue. Two channels can produce the same pipeline per dollar and still have very different real costs per customer, because one closes far more of what it creates.
That is why win rate belongs next to CAC by channel in any budget conversation. Pipeline per channel tells you which channel fills the top of the funnel. Win rate tells you how much of that pipeline turns into customers. CAC tells you what each customer cost. You need all of them before you move budget.
It also changes how you judge newer sources. Visitors who arrive from AI assistants like ChatGPT, Claude, Perplexity, and Gemini are a small slice of traffic for most B2B sites, but they often arrive already researched. Tracking their win rate as its own channel, instead of burying them in direct traffic, shows whether that research turns into deals. Our guide to LLM attribution and ChatGPT traffic covers how to separate them.
Why is win rate by channel hard to get right?
Usually because the CRM data under it is messy. The common problems are easy to spot once you look for them.
- Opportunities with no lead source, or a lead source someone typed by hand.
- Lost deals that never get closed out, so they sit open forever and inflate win rates.
- Opportunities created from existing customers mixed in with new business.
- A channel field in HubSpot or Salesforce that records the last form fill, not the first visit.
Self-reported attribution helps fill gaps for channels that do not leave a click, like podcasts and word of mouth. Our self-reported attribution checklist shows how to add a how-did-you-hear field that you can actually report on.
How Source calculates win rate by channel
Source connects the website visit to the CRM deal, so every opportunity carries its full path: the first visit, every touch in between, and the stage it ended in. You install one pixel or add it through Google Tag Manager. There is no warehouse to build.
From there you can ask for win rate by channel under first touch, last touch, or multi-touch, and see it next to pipeline, real CAC, and channel quality. Paid clicks, view-through, offline touches, and LLM referrals all sit on the same path. If you work in Claude or ChatGPT, you can ask the same question through the Source MCP and get the numbers back in the chat.
If you want to see your own win rate by channel, you can start free on Source and connect your CRM.