


How to read CAC by channel when B2B deals take months
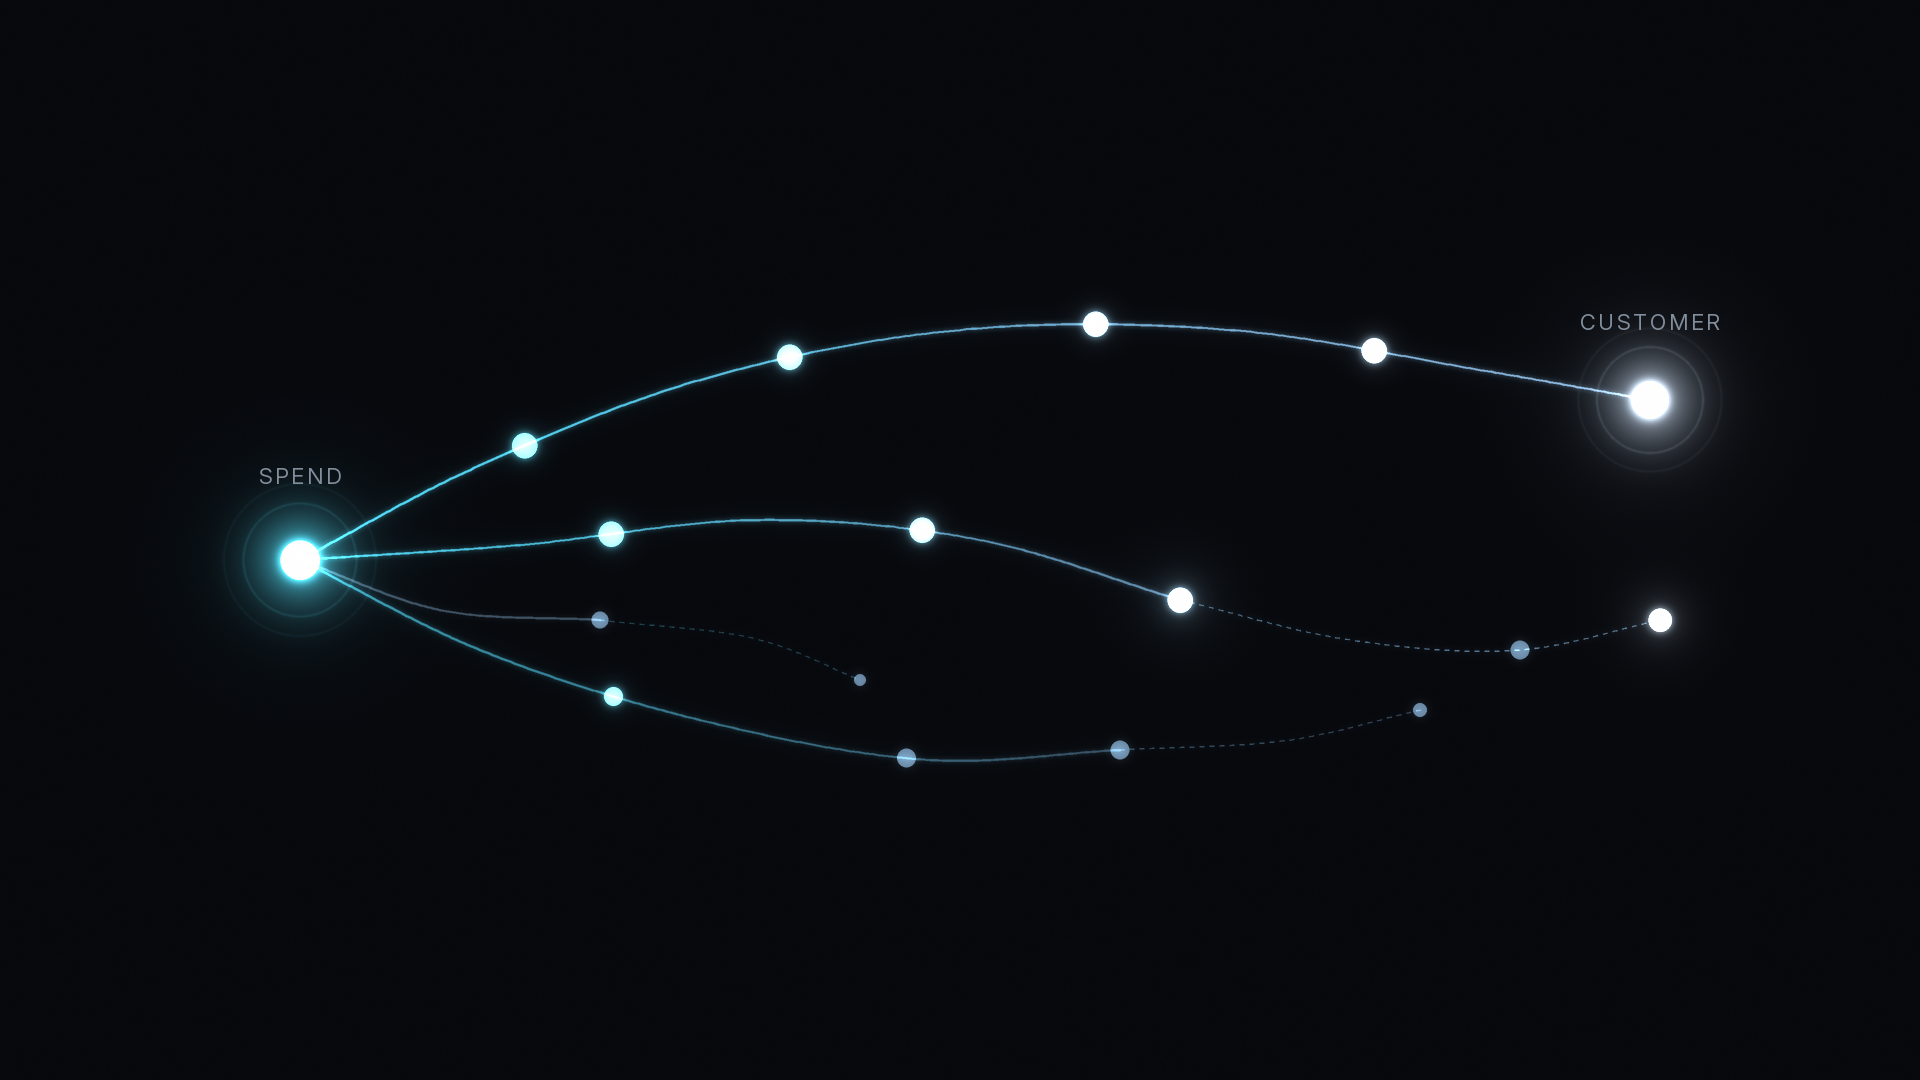
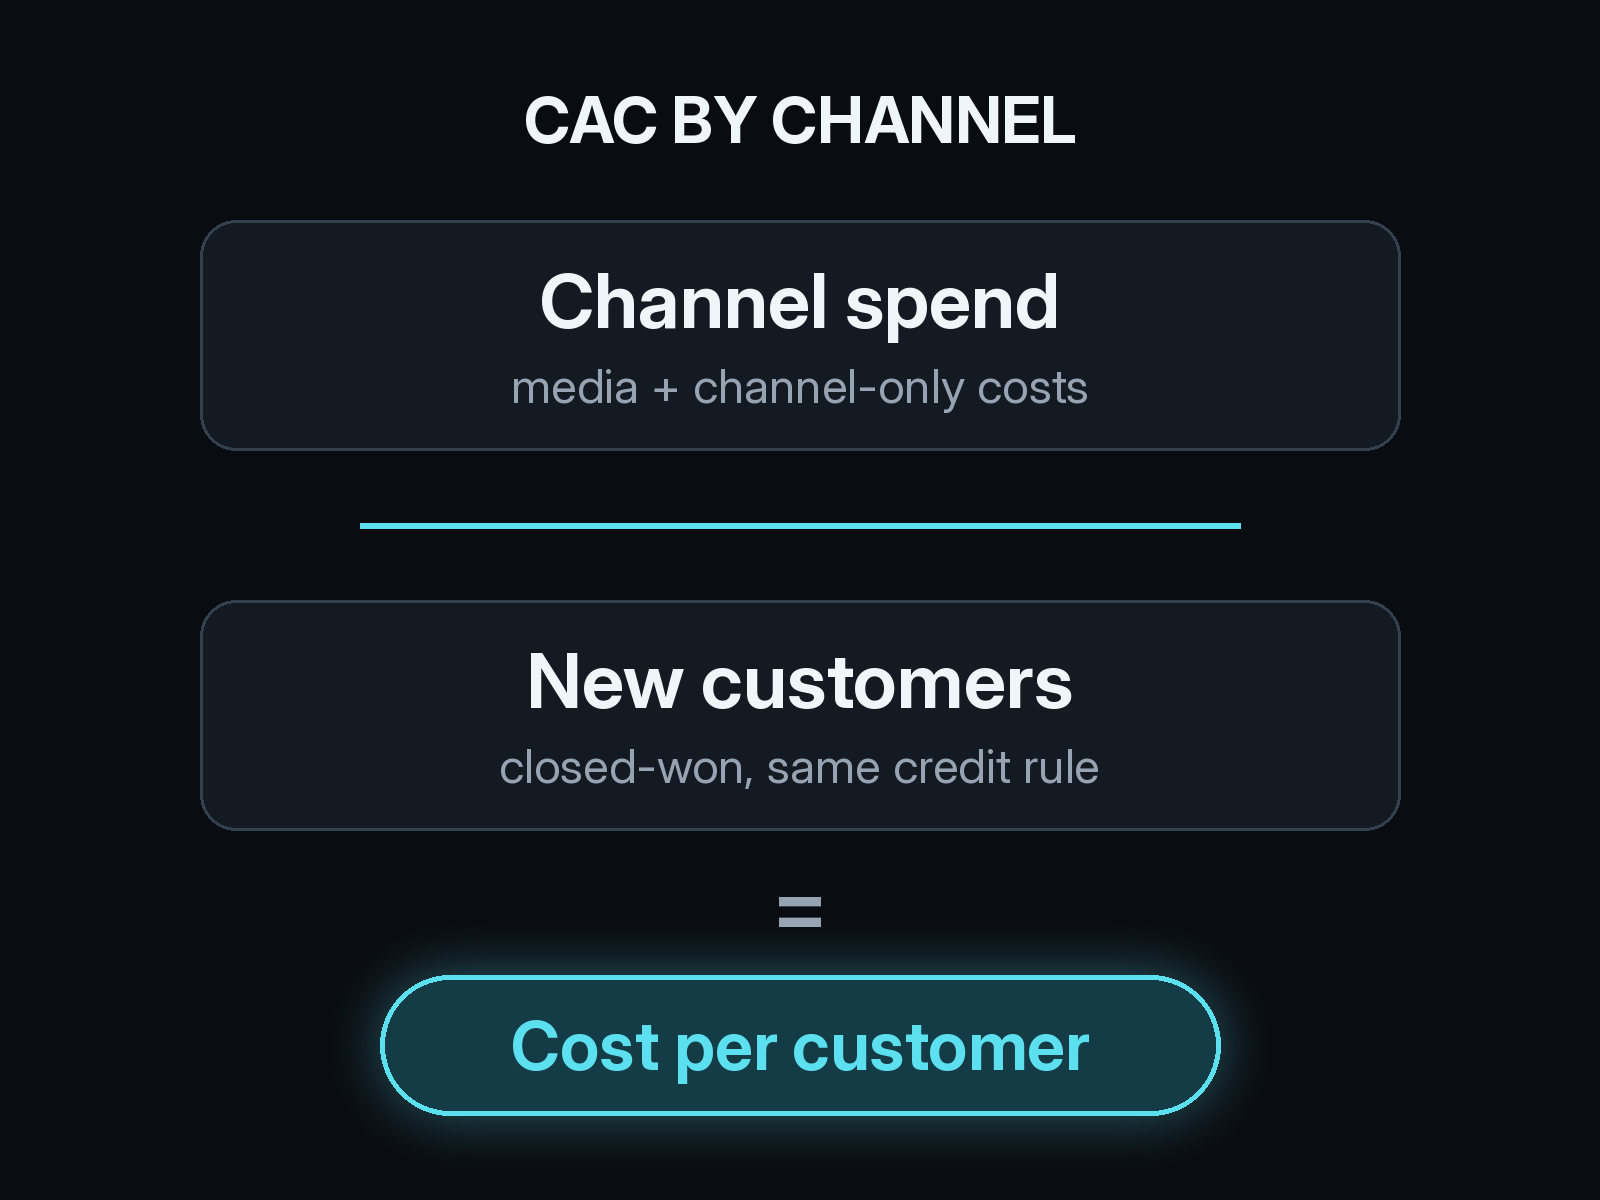
CAC by channel is what one channel cost you divided by the new customers that channel started. In B2B the hard part is timing. Spend lands this month and the deals it started close months later, so dividing this month's spend by this month's closed deals compares two different groups of buyers.
Blended CAC (total sales and marketing cost divided by total new customers) is still the number finance reports. It shows whether acquisition is getting cheaper or more expensive overall. It cannot tell you which line in the budget to move, and that is the question channel CAC is for.
What goes into CAC by channel
The top of the formula is what the channel cost in the period: media spend plus the costs that exist only because of that channel. An agency retainer for LinkedIn Ads, a booth fee for an event, or the production cost of a sponsored podcast all count. Shared costs like salaries and your website usually stay in blended CAC, because splitting them by channel adds opinion and very little information.
The bottom is new customers credited to that channel. A customer here is a closed-won Deal from a new account. Leads, MQLs, and booked Meetings belong in other metrics. Divide spend by Meetings and you get cost per Meeting, which is worth tracking on its own.
The credit rule decides how a customer gets split when several channels touched the path. First-touch gives the whole customer to the channel behind the first Visit. Multi-touch spreads it across the Visits, Pages, and Meetings on the path. If you are still settling that choice, start with how to choose between single-touch and multi-touch attribution. Whichever rule you pick, apply it to every channel and every quarter. Otherwise channel CAC moves because the rule moved.
Why the time window breaks channel CAC in B2B
Channels close at different speeds. Google Ads search campaigns often catch buyers who are already comparing vendors, so those Deals tend to close sooner. Paid social, events, and podcasts usually reach people earlier, and the first Visit can come long before anyone books a Meeting.
Divide each month's spend by that month's closed Deals and the slower channel looks expensive while it is building pipeline. Months later its Deals land, it suddenly looks cheap, and by then the budget may already be cut.
Cohorts fix the mismatch. Group Deals by the month of the first credited touch, then compare that month's spend against the customers the cohort produced once they have had time to close. The method is the same one you use to tie pipeline back to the first visit, applied to cost.
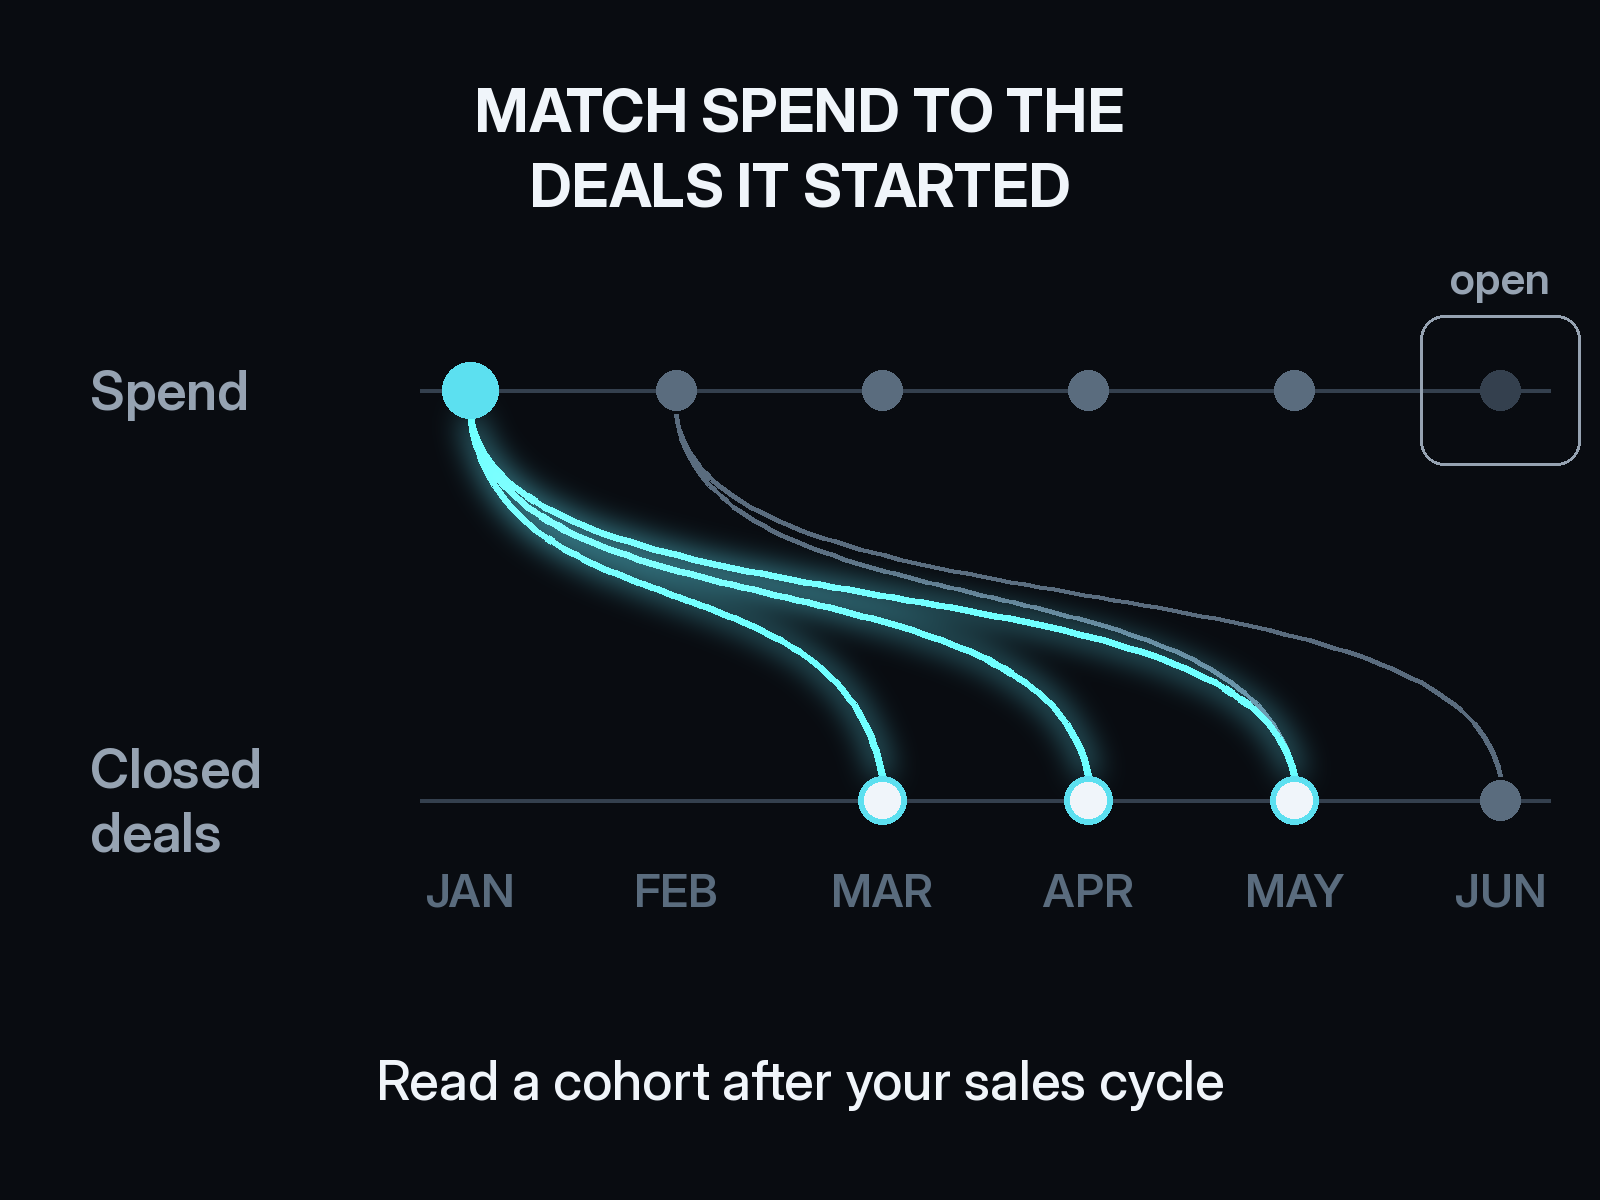
Your sales cycle sets the window. Look at the typical time from first Visit to closed-won on recent Deals and wait at least that long before you read a cohort's CAC. Recent cohorts will look expensive because their customers have not closed yet. Mark them as open and keep them out of budget decisions until they mature.
Where CAC by channel undercounts a channel
View-through is the first. A buyer sees a LinkedIn ad, never clicks, and comes back through search a week later. Click-only reporting gives the customer to search, so the ad channel carries the cost and none of the customers. Counting view-through attribution in B2B on the same path puts part of that customer back where the demand started.
LLM referrals are next. Buyers ask ChatGPT, Claude, Perplexity, or Gemini for vendor options and arrive with a thin referrer or none. When those Visits fall into Direct, the content that earned the mention shows cost and zero customers. The fix starts with attributing ChatGPT and other LLM traffic as its own source.
Offline and sales-assisted work gets missed too. Events, partner intros, and outbound often start the conversation away from your site. If a rep creates the Meeting by hand in HubSpot or Salesforce with no link back to a Visit, the channel that paid for the booth gets no customers in the math.
Then there is Direct. A large Direct bucket with real customers in it usually means some of the stitches above are missing. Report Direct's customer count next to channel CAC so nobody reads a thin channel as an efficient one. For the recovery work, see how to find the deals hiding in Direct traffic.
How to read the number once you have it
Put deal size next to CAC on the same row. A channel with higher CAC can still be the better buy when its customers sign bigger contracts or stay longer, and a cheap channel that brings small accounts can cost you more over a year.
Read trends inside one channel before you rank channels against each other. When paid search CAC climbs across several mature cohorts in a row, act on it. One cohort that jumps is often one large Deal or one slow month.
CAC payback uses the same inputs. Divide a channel's CAC by the monthly gross margin a customer from that channel brings in, and you get the number of months it takes to earn the acquisition cost back. Finance usually asks for payback by channel once it trusts the CAC row.
When the number goes to leadership, show the credit rule, the cohort window, and which cohorts are still open. That is most of what it takes to put marketing attribution on the board slide without a debate about method.
How Source calculates CAC by channel
Source keeps the Visit, the Pages, the Meeting, and the closed Deal on one path with one pixel and the GTM tools you already run. No warehouse. Connect your ad accounts and CRM, and CAC by channel comes from the customers each channel actually started. Multi-touch, view-through, offline, and LLM attribution sit on that same path, and you can set goals per channel and watch channel quality next to cost.
You can chat with your data, get AI recommendations on where to move budget, and receive a daily Slack report. Source is SOC 2 Type II and ISO 27001 certified, and customer data is not used to train external models.
To see channel CAC on your own Deals, start a free Source account or read more at source.app.